- Grafana Plugin for TDengine
TDengine is open-sourced big data platform under GNU AGPL v3.0, designed and optimized for the Internet of Things (IoT), Connected Cars, Industrial IoT, and IT Infrastructure and Application Monitoring, developed by TDengine.
TDengine data source plugin is developed for Grafana. This document explains how to install and configure the data source plugin, and use it as a time-series database. We'll take a look at the data source options, variables, querying, and other options specific to this data source.
At first, please refer to Add a data source for instructions on how to add a data source to Grafana. Note that, only users with the organization admin role can add data sources.
To install this plugin, please refer to Install the Grafana Plugin for TDengine
To build the plugin from source, prepare both the Go backend toolchain and the Node.js frontend toolchain.
- Go 1.21 or above
- Node.js 22 or above
- Yarn 1.22.4 (recommended by
packageManager) or npm for running equivalent scripts jqandzipif you want to create the release zip fromscripts/package.sh- A local Grafana instance if you want to load and verify the built plugin interactively
A common Linux setup is:
# Ubuntu/Debian example
sudo apt update
sudo apt install -y golang-go jq zip
corepack enable
corepack prepare yarn@1.22.4 --activateFrom the repository root, install dependencies for both parts of the plugin and then build the frontend bundle plus the backend executable.
yarn install --frozen-lockfile
go mod download- Frontend only:
yarn build
- Backend only:
go run github.com/magefile/mage@latest
- Full distributable
dist/directory (frontend bundle + backend executable):yarn build:dist
If you already have mage installed, you can replace go run github.com/magefile/mage@latest with mage.
Run the frontend and backend tests separately:
- Frontend unit tests:
Equivalent npm command:
yarn test:ci
npm run test:ci
- Backend tests:
go test ./... - Optional static checks before packaging:
yarn typecheck
yarn lint
The production build output is written to dist/. To create a release archive after building:
yarn build:dist
yarn package
This uses scripts/package.sh to copy dist/ into a tdengine-datasource/ staging directory and generate tdengine-datasource-<version>.zip.
If you need a signed package for distribution, configure the appropriate Grafana signing credentials and run:
yarn build:allFor a local Grafana installation, copy the built plugin into Grafana's plugins directory and restart Grafana.
GF_PLUGINS_DIR=/var/lib/grafana/plugins
yarn build:dist
sudo rsync -rlzP dist/ "$GF_PLUGINS_DIR/tdengine-datasource"
sudo chmod +x "$GF_PLUGINS_DIR/tdengine-datasource"/tdengine-datasource*
sudo systemctl restart grafana-server
If your Grafana installation uses a different plugins directory, adjust GF_PLUGINS_DIR accordingly. For additional installation options, including prebuilt release downloads and macOS-specific guidance, see Install the Grafana Plugin for TDengine.
Now it's ready for you to add your own TDengine data source and use it in a dashboard. Refer to Grafana Datasource documentations topic - Add a data source for a quick view. Please make sure the TDengine backend daemon taosd and TDengine RESTful service backend daemon taosadapter already launched.
Point to Configurations -> Data Sources menu and then Add data source button.

Search and choose TDengine.

If TDengine is not in the list, please check the installation instructions for allowing loading unsigned plugins.
Configure TDengine data source for Grafana version 11.
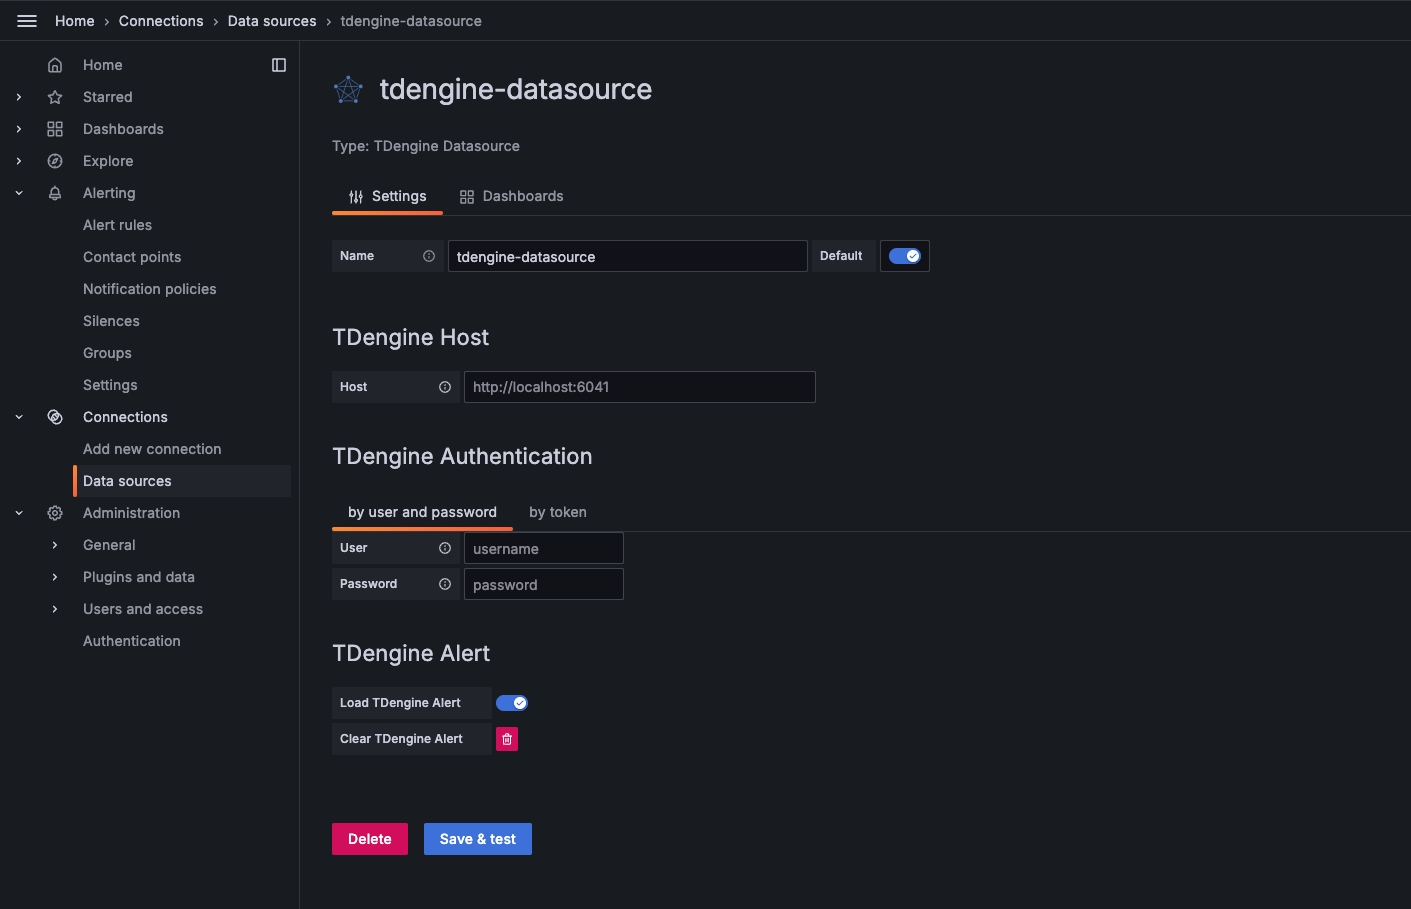 Note:
Note:
- Close the Load TDengine Alert button to prevent automatic import of alert rules when adding data sources.
- When deleting a data source, it is necessary to first clear the imported alert rules
Configure TDengine data source for Grafana with version lower than 11.

Save and test it, it should say 'TDengine Data source is working'.

Configure the data source URL with an HTTPS endpoint, for example https://localhost:6041.
Authentication includes a collapsed TLS/SSL section in Grafana 8.0 and newer. Prefer supplying a PEM-encoded CA certificate, which keeps certificate and host-name verification enabled. Enable Skip TLS certificate validation only for controlled testing because it exposes the connection to man-in-the-middle attacks.
Provisioning uses Grafana's standard TLS fields:
jsonData:
  tlsAuthWithCACert: true
  tlsSkipVerify: false
secureJsonData:
  tlsCACert: |-
    -----BEGIN CERTIFICATE-----
    ...
-----END CERTIFICATE-----Point to + / Create - import (or /assets/import url).

Now you can import dashboard with JSON file or grafana dashboard id (please make sure your network is public to https://grafana.com).
Here is the first grafana dashboard you want to use for TDengine, the grafana dashboard id is 18180.

After import:

- TDinsightV3 gained a collapsed Stream Computing row: streams total/failed stats, per-stream realtime lag and history progress, streams overview (status, message, throughput) and stream recalculation jobs.
- Added two predefined stream alert rules to the
alert_1mgroup: Stream Failed Alert (notification carries the TDengine error code) and Stream Recalc Failed Alert (notification carries the failure reason fromins_stream_recalculates.message). Both carry aservice=streamlabel for notification-policy routing. - The Stream Computing panels and stream alert rules require TDengine v3.4.2.7 or later.
- Added TLS/SSL configuration with custom CA support and an explicit certificate-verification bypass for controlled testing.
- Updated the bundled TDinsightV3 and taosX dashboards so Grafana 13 imports require selecting the TDengine data source only once while retaining Grafana 8 compatibility.
- Updated the legacy TDinsight provisioning script to use the TDInsight V3 Dashboard ID
18180.
- Disabled automatic HTTP redirects for datasource requests to prevent credentials and query payloads from being forwarded to redirected endpoints.
- Removed raw SQL from HTTP-status and TDengine query-error messages returned to Grafana and written at Error level.
- Datasource URLs must point directly to the final TDengine REST endpoint. Configurations relying on HTTP 3xx redirects must update the URL before upgrading.
v4.0.0 - Breaking Changes Release
This version includes breaking changes that require action from users. Please read the migration guide carefully before upgrading.
-
Removed deprecated query fields:
alias: Use SQLASclause insteadcolNameFormatStr: Use Grafana's field display name featurecolNameToGroup: Use SQLGROUP BYwith proper column aliasestimeShift,timeShiftPeriod,timeShiftUnit: Use Grafana's time range overrides in panel options
-
QueryEditor simplified: Removed "Alias By", "Group By Column(s)", and "Group By Format" UI inputs. Query editor now supports SQL-only flow.
-
Legacy dashboards removed: TDinsight V2 and Monitor dashboard are removed. Use TDinsightV3 or taosX dashboards instead.
-
Minimum Grafana version: Now requires Grafana 8.0+ (previously 7.5+)
If your existing dashboards use the removed fields, you need to update them:
OLD (v3.x):
{
  "alias": "My Metric",
  "colNameFormatStr": "location_{{value}}",
  "colNameToGroup": "location",
  "formatType": "Time series"
}
NEW (v4.0.0):
{
  "formatType": "Time series"
}
Use SQL AS clause for aliasing:
SELECT value AS my_metric FROM ...Use Grafana's field display name override for grouped data:
"fieldConfig": {
  "defaults": {
    "displayName": "prefix_${__field.labels.label_name}",
  },
  "overrides": []
}Use the new time macros for better time filtering:
-- Time filter macro
SELECT * FROM sensors
WHERE $__timeFilter(ts)
GROUP BY tbname;

-- Explicit time range macros
SELECT * FROM sensors
WHERE ts >= $__timeFrom AND ts < $__timeTo;If you have alert rules using the removed fields:
- Export your alert rules before upgrading (Grafana UI → Alerting → New alert rule → Export)
- Update queries to remove deprecated fields
- Re-import alerts using Grafana's alert provisioning API
If you encounter issues after upgrading:
- Uninstall plugin v4.0.0
- Reinstall plugin v3.8.0
- Your dashboards will work again (but still need migration for future upgrades)
- Enhanced SQL macros: Added
$__timeFrom,$__timeTo,$__timeFilter(column)for better time range handling
- Fixed label parsing issue when dimension values contain spaces
- Fixed alert tag extraction for queries with grouped dimensions
-
Grafana 11 versions
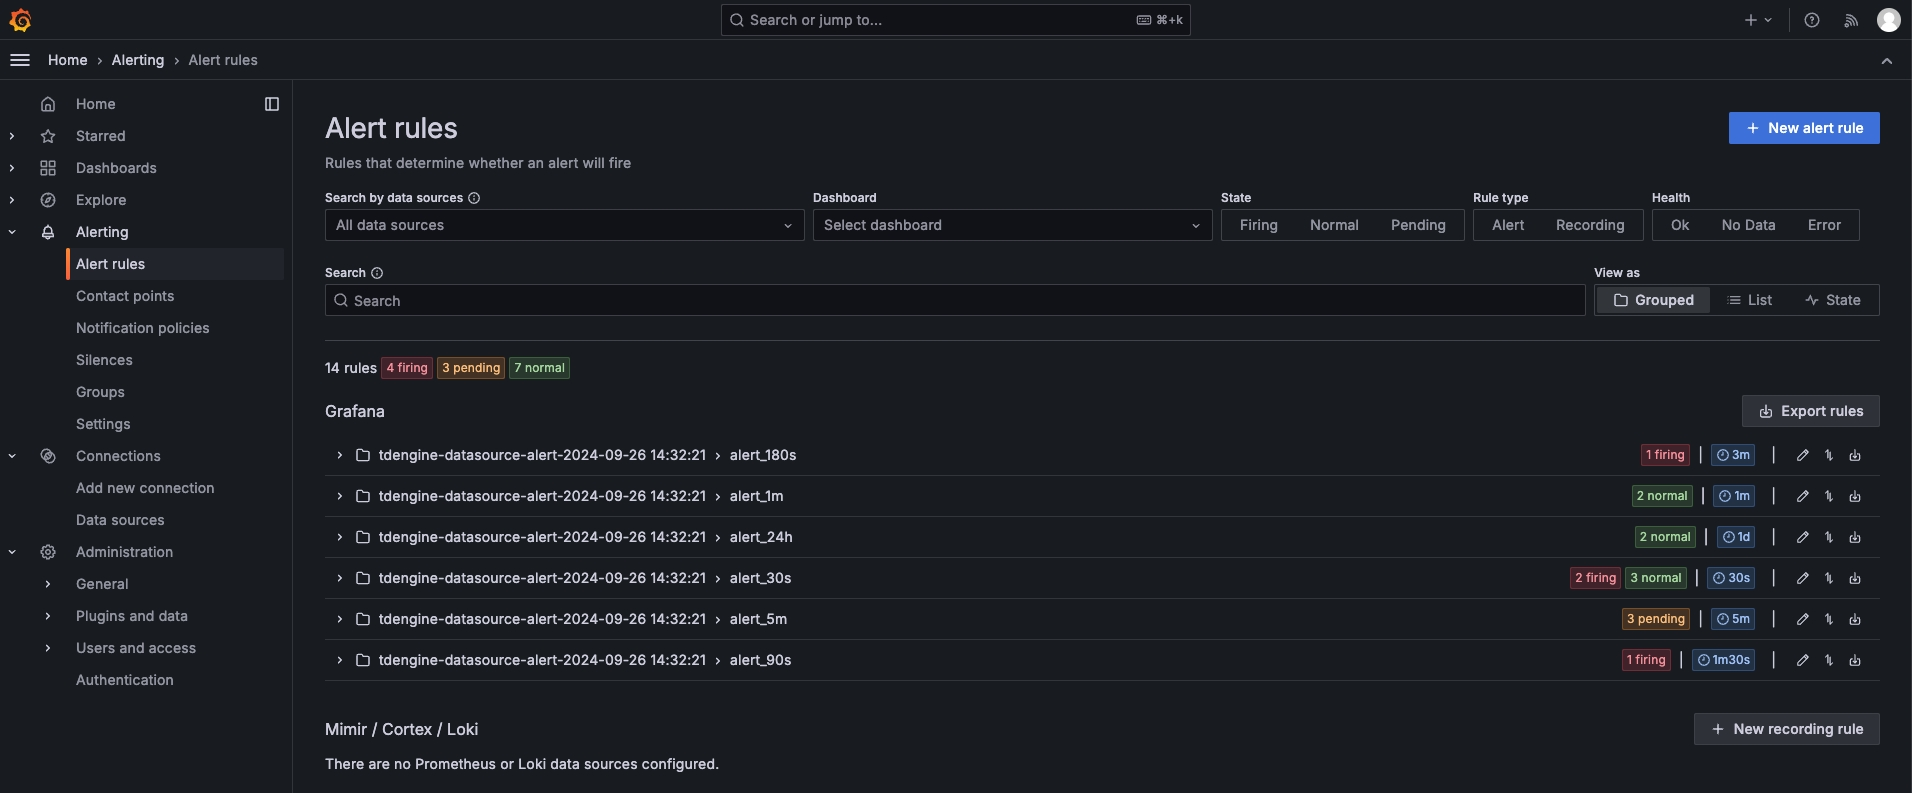
The TDengine data source plugin has added functionality for Grafana 11 versions, which can automatically import and clear alerts for basic metrics of the TDengine cluster (such as CPU, memory, dnode, vnode, etc.) when adding data sources.
Note:(1)Close the Load TDengine Alert button to prevent automatic import of alert rules when adding data sources.
(2)When deleting a data source, it is necessary to first clear the imported alarm rules.
After adding the data source, you will see the automatically imported alert configuration in the alert management menu.
-
Grafana 8.0 versions
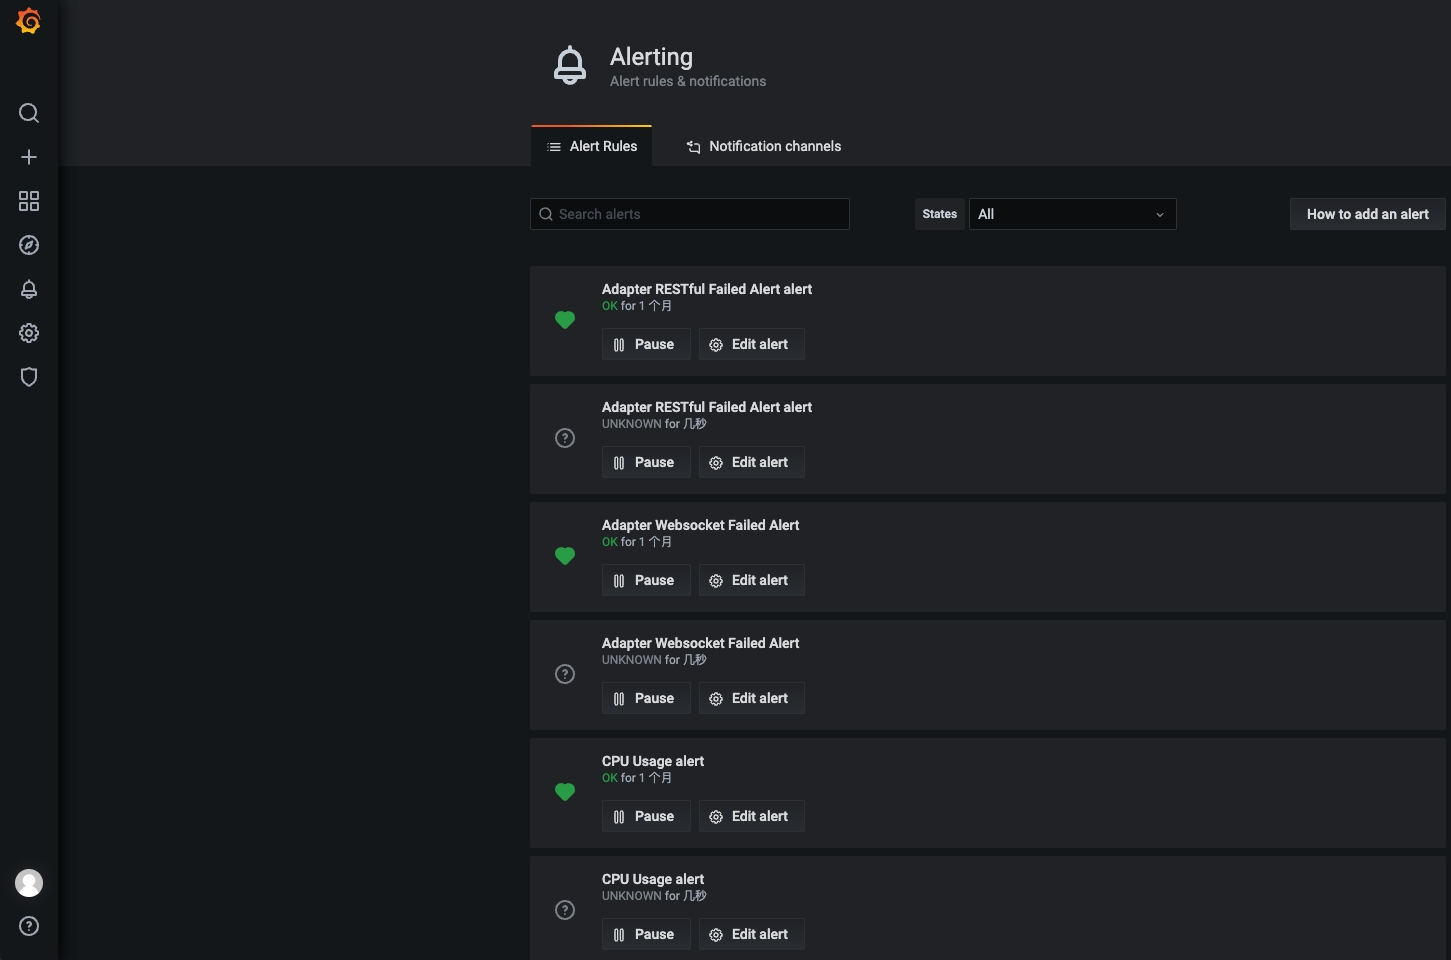
The TDengine data source plugin has added functionality for Grafana 8.0 versions, which can automatically import and clear alerts for basic metrics of the TDengine cluster (such as CPU, memory, dnode, vnode, etc.) when adding data sources.
To import the Dashboard, enter "TDinsight for 3.x Dashboard" and click save. Subsequently, the loaded alert rules will appear in the alert menu as shown below.
-
TDengine data source plugin uses secureJsonData to store sensitive data. It will cause a breaking change when you're upgrading from an older version:
The simple way to migrate from older version is to reconfigure the data source like adding a data source from scratch.
If you're using Grafana provisioning configurations, you should change the data source provisioning configuration file to use
secureJsonData:apiVersion: 1 datasources: # <string, required> name of the datasource. Required - name: TDengine # <string, required> datasource type. Required type: tdengine-datasource # <string, required> access mode. direct or proxy. Required # <int> org id. will default to orgId 1 if not specified orgId: 1 # <string> url to TDengine rest api, eg. http://td1:6041 url: "$TDENGINE_API" # <bool> mark as default datasource. Max one per org isDefault: true # Optional TLS settings. Certificate verification is enabled by default. # Set tlsAuthWithCACert to true when tlsCACert is supplied. jsonData: tlsAuthWithCACert: false tlsSkipVerify: false # <map> secureJsonData: # <string> a redundant url configuration. Required. url: "$TDENGINE_API" # <string> basic authorization token. Required, can be build like # `printf root:taosdata|base64` basicAuth: "${TDENGINE_BASIC_AUTH}" # <string> cloud service token of TDengine, optional. token: "$TDENGINE_CLOUD_TOKEN" # Optional PEM-encoded CA certificate for TLS verification. # tlsCACert: "$TDENGINE_TLS_CA_CERT" version: 1 # <bool> allow users to edit datasources from the UI. editable: true
-
Now users can quickly import TDinsight dashboard in Dashboards tab in a datasource configuration page.

TDinsight is a simple monitoring solution for TDengine database. See TDinsight README for the details.
The plugin ships stream computing monitoring panels and alert rules. The panels query the TDengine stream system views (information_schema.ins_streams and information_schema.ins_stream_recalculates, served from mnode in-memory state); the stream failure alert reads failure events reported by taosd into the log database supertable taosd_stream_failure.
TDengine version requirement: these panels and alert rules require TDengine 3.4.2.7 or later, which includes the stream observability feature (the
realtime_lag_ms,history_progress_pctandins_stream_recalculates.statuscolumns, plus stream failure reporting tolog.taosd_stream_failure). Thelog.taosd_stream_failuresupertable is created automatically on the first reported failure — until then, and on older TDengine versions, the related panels and alert rules will report query errors; this is expected.
TDinsightV3 contains a collapsed Stream Computing row with the following panels:
| Panel | Type | What it shows |
|---|---|---|
| Streams Total | stat | Total number of streams |
| Failed Streams | stat | Number of streams in Failed status (red when > 0) |
| Streams Overview | table | stream_name, status, message (error reason), realtime_lag_ms, input/output throughput, result latency and history_progress_pct of all streams |
| History Progress | bargauge | Initial history calculation progress (0-100%) per stream |
| Realtime Lag per Stream | bargauge | Realtime processing lag (ms) of the slowest active reader per stream |
| Stream Recalculations | table | Manual recalculation jobs: range, progress and status |
The system views only hold current state (no history), so the section intentionally contains no time-series panels.
When Load TDengine Alert is enabled on the data source (Grafana >= 11), two stream alert rules are provisioned into the existing alert_1m rule group (evaluation interval 60s):
- Stream Failed Alert (
severity=critical): event-based. taosd reports every stream failure to thelog.taosd_stream_failuresupertable (tagscluster_id/stream_id/stream_name, columnerror_code), and the rule fires one alert instance per stream for failures seen in the last 120 seconds. Unlike a status poll, this cannot miss failures of streams that are automatically restarted and quickly return toRunning. Each instance is labeled withstream_nameandcluster_id, and the notification shows which stream failed and the error code, e.g.Stream s_demo (cluster: ...) failed, error code: -2147479517. Query:select now(), cluster_id, stream_name, last(cast(error_code as bigint)) as error_code from log.taosd_stream_failure where _ts >= (now - 120s) and _ts < now partition by cluster_id, stream_name having first(_ts) > 0. - Stream Recalc Failed Alert (
severity=warning): one alert instance per failed recalculation job, labeled withstream_name,recalc_id, theprogressthe job reached before failing and the failuremessage, so the notification shows which recalc job of which stream failed and why (the failure reason comes from the view'smessagecolumn). Failed recalculation records are kept in memory for 1 hour, so such an instance recovers automatically afterwards. Query:select now() as ts, stream_name, recalc_id, progress, message, count(*) as failed from information_schema.ins_stream_recalculates where status = 'Failed' partition by stream_name, recalc_id, progress, message.
Both rules use noDataState=OK (no failure events is the normal state — a firing instance recovers automatically once its event ages out, without emitting Grafana's noisy DatasourceNoData pseudo-alert) and execErrState="Error" (on older TDengine versions the rule shows an error state instead of misfiring).
DingTalk delivery is configured in Grafana, not in the plugin:
- Alerting -> Contact points -> New contact point: choose type DingTalk, fill in the DingTalk robot webhook URL (and secret if enabled on the robot).
- Alerting -> Notification policies -> New nested policy: add matcher
service = streamand route it to the DingTalk contact point created above (both stream alert rules carry the labelservice=stream). - When a stream fails, the DingTalk group receives one message per alert instance containing the stream name and the failure error code.
For a quick look and test, you can use docker-compose to start a full Grafana + AlertManager + Alert Webhook stack:
docker-compose up -dServices:
- Grafana: http://localhost:3000
- AlertManager: http://localhost:9093, in docker it's http://alertmanager:9010/sms
- Webhook: http://localhost:9010/sms, in docker it's http://webhook:9010/sms
You can get other dashboards in the examples' directory, or search in grafana with TDengine datasource https://grafana.com/grafana/dashboards/?orderBy=downloads&direction=desc&dataSource=tdengine-datasource .
Here is a short list:
You could open a pr to add one if you want to share your dashboard with TDengine community, we appreciate your contribution!